Contact & Feedback |
 Twitter |
About us Twitter |
About us[Helper] Predictiveness R code
|
| Input |
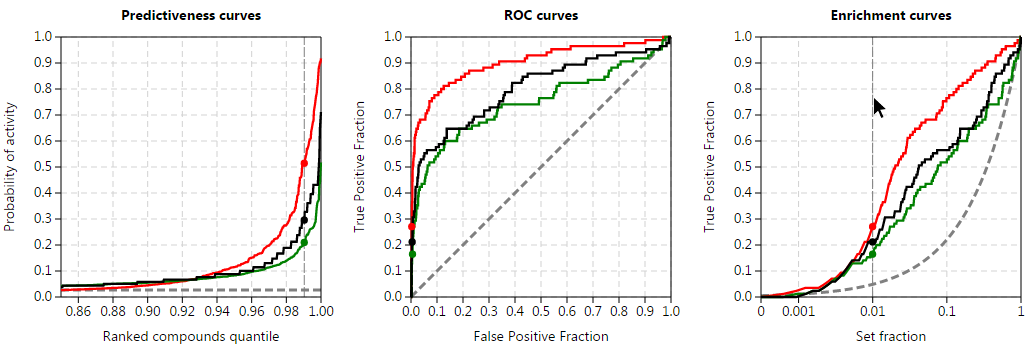
This application is divided into two successive parts allowing the retrospective evaluation of the performances of: -- (1) individual scoring functions (Provide Scores and Activity tags, file preview in Demo 2) -- (2) consensus scoring (Provide Compounds identifiers, Scores and Activity tags, file preview in Demo 1) Compounds ranking must be decreasing. Up to 10 datasets can be compared and used for consensus scoring. Use parser options to precise the presence of compounds identifiers, select the separator and ignore a file header. | |
| Output | Interactive charts & metrics: Predictiveness, ROC, enrichment curves, scores and active compounds distributions. All usual global metrics. Mouse over the charts to display partial metrics. Simple consensus methods are also included. | |
| Usage | Click on a chart to freeze/unfreeze mouse interaction. Resizing charts may be convenient. Charts and metrics are exportable as files (Buttons  for Chrome, Firefox & Safari). for Chrome, Firefox & Safari). |
Select a CSV file to generate interactive charts – or have a quick look at our demo data !